Greek Used Cars Market Analysis

Greek Used Cars Market Analysis — Python web scraping and end-to-end data analysis of 274,000+ listings
Python Selenium Pandas Jupyter Analytics Web Scraping Data Cleaning Data Analysis
2024

Dataset

305,595 Raw listings collected
274,192 Final clean dataset
3 Seasonal data collection intervals
3.18% Mean price increase, winter to summer
4.36% Median price increase, winter to summer

Objective

Test a hypothesis: do used car prices in Greece rise in winter and fall in summer? Also a project to sharpen Python skills across web scraping, data cleaning, and end-to-end analysis using real market data.

Approach

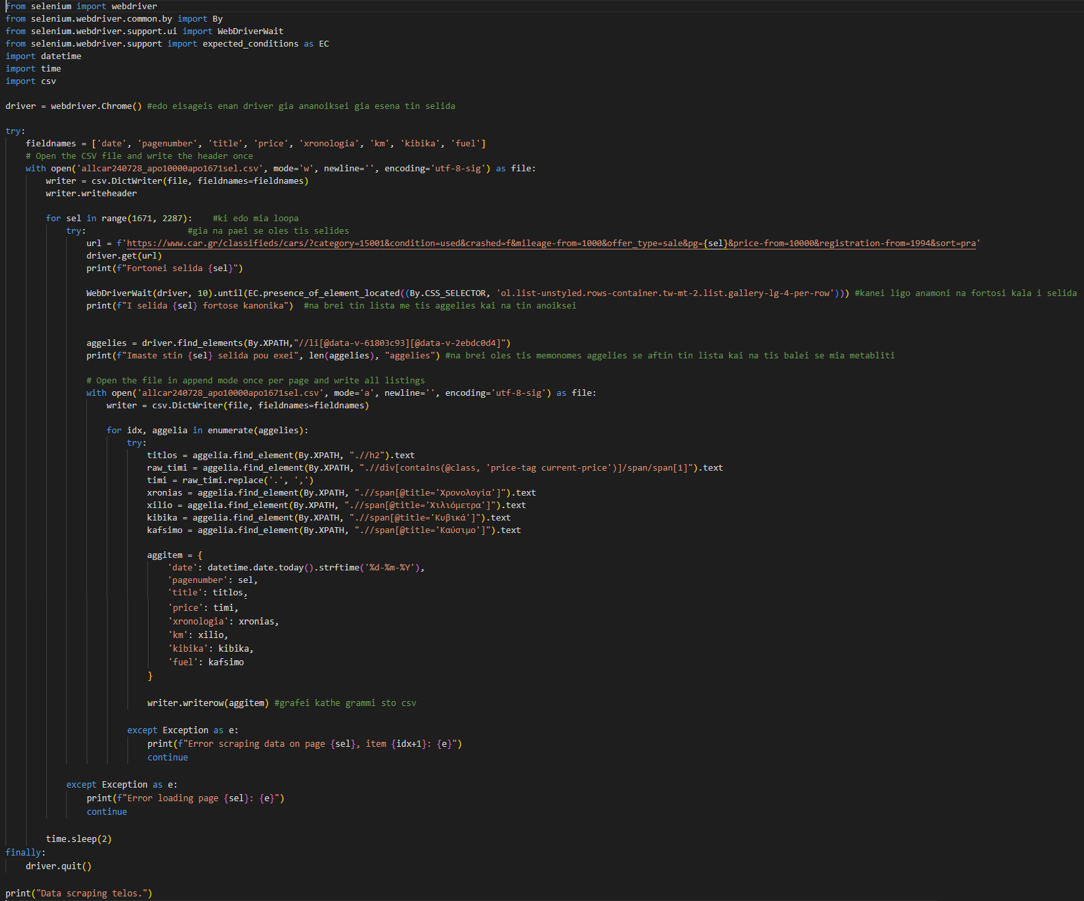
Scraped Greece's largest used car marketplace three times at three-month intervals using Python and Selenium, capturing seasonal price variation across a full market cycle. Selenium handled dynamic page content that standard requests couldn't reach.

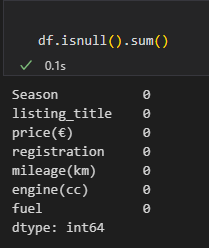
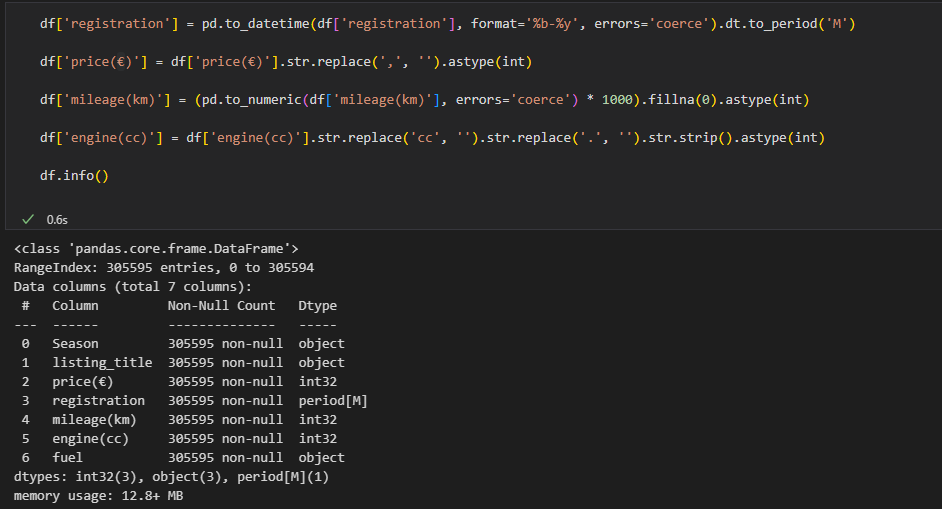
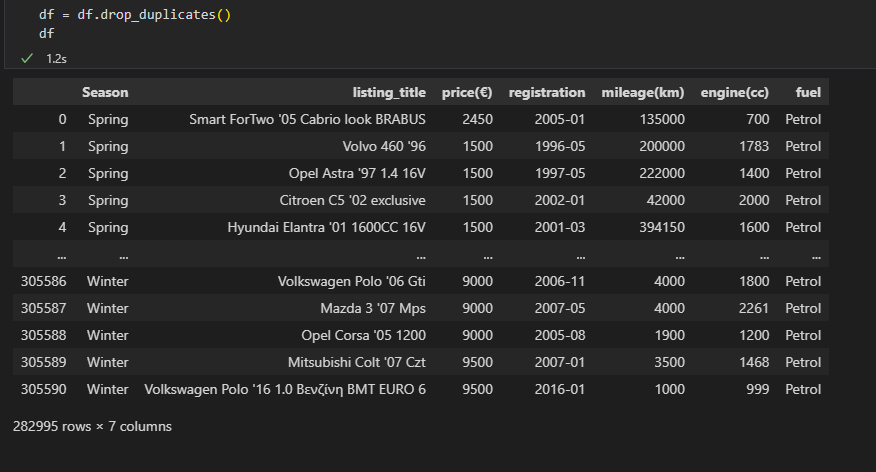
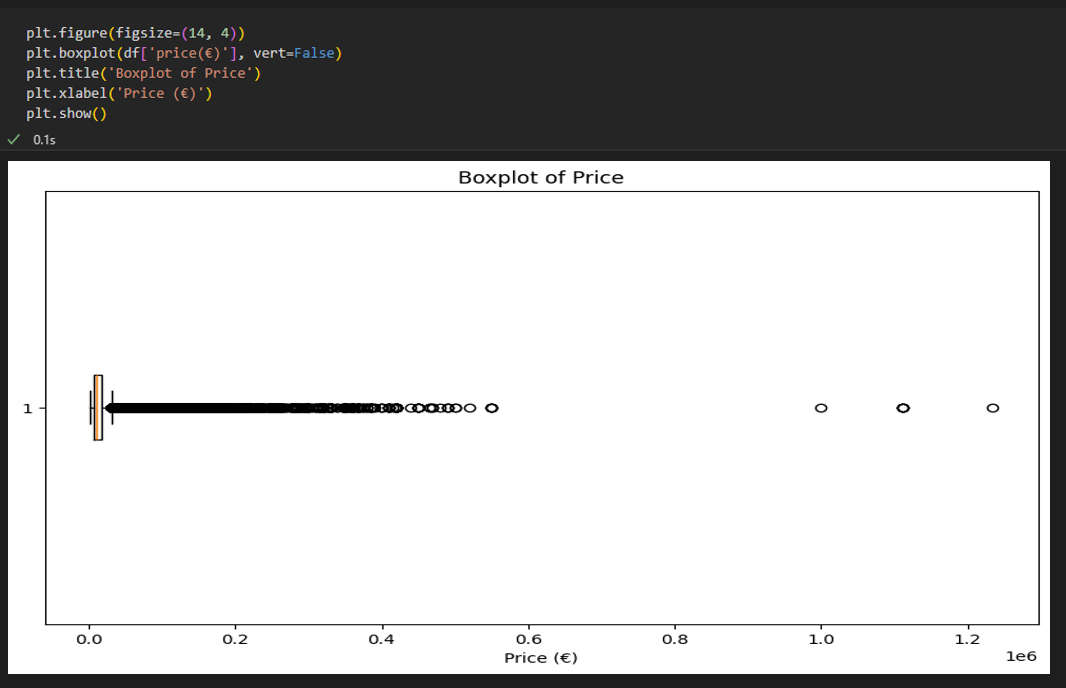
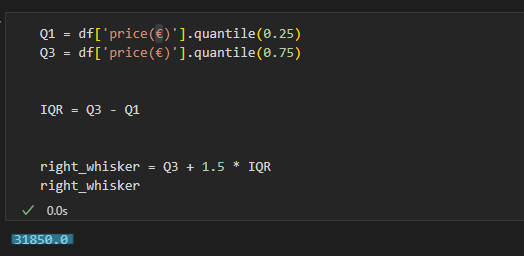
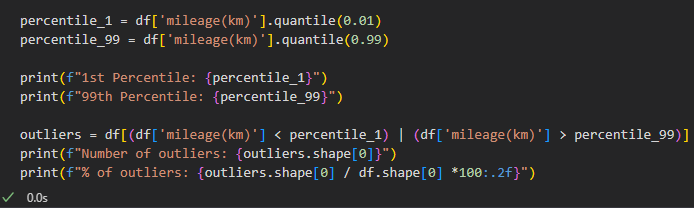
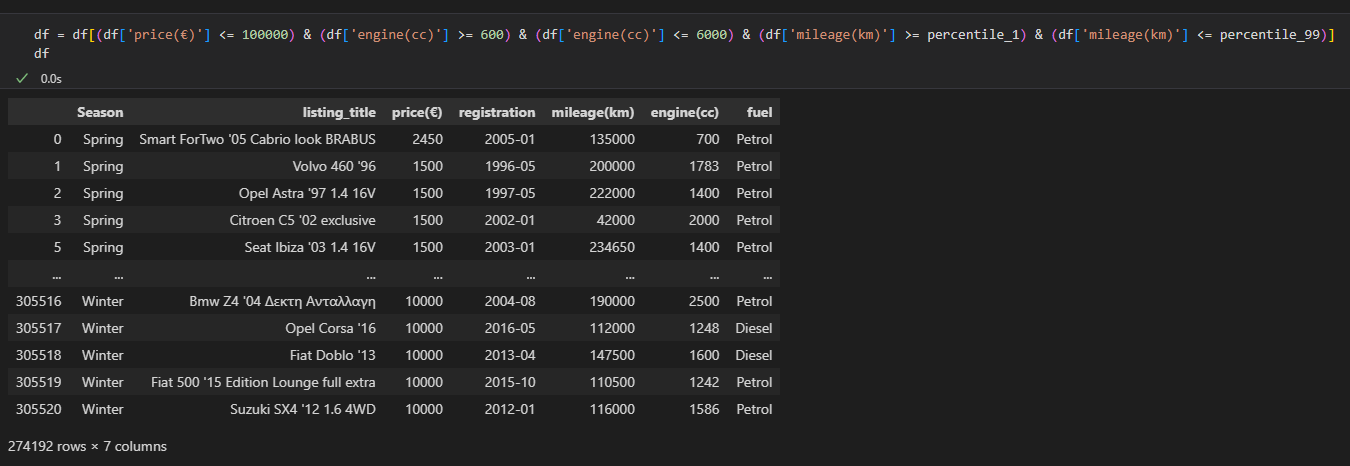
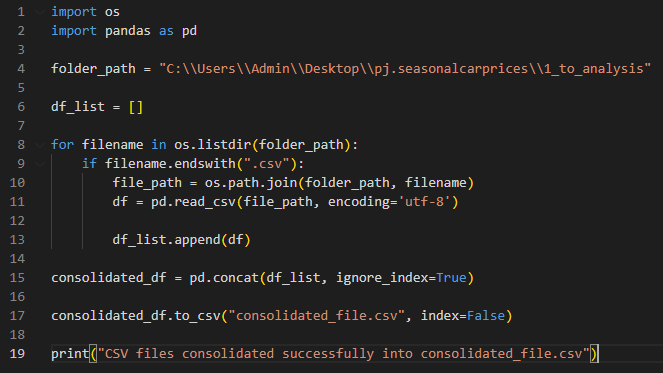
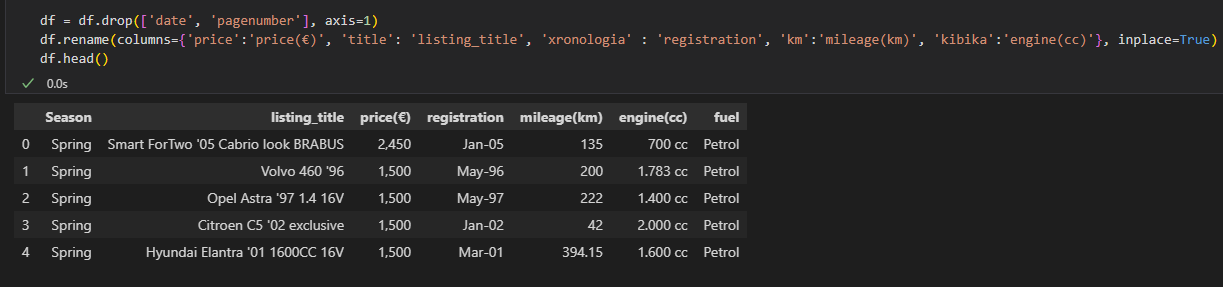
Raw dataset of 305,595 listings was cleaned in stages: duplicate records removed (22,600 removed, ~7.4%), outliers filtered on price (listings above €100k), mileage (1st and 99th percentile), and engine size (bottom 0.4% and top 0.1%). Final clean dataset: 274,192 listings.

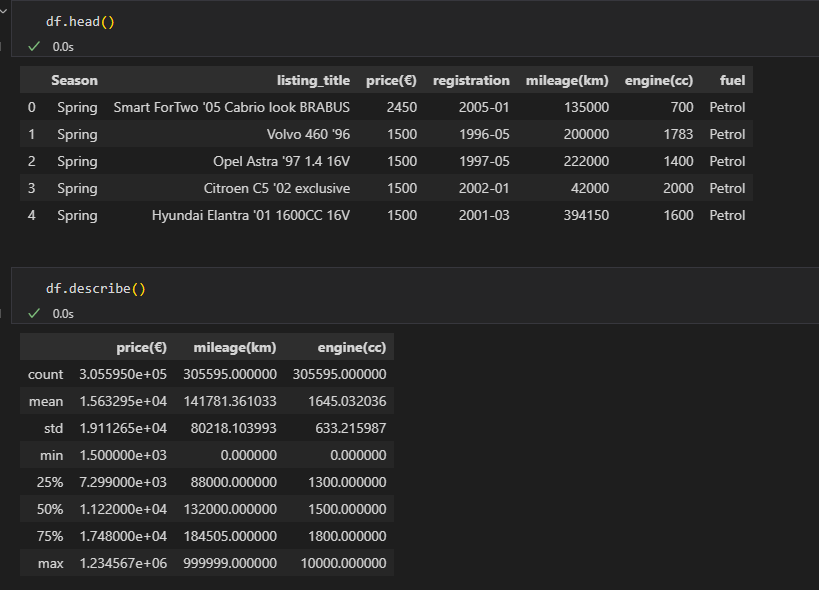
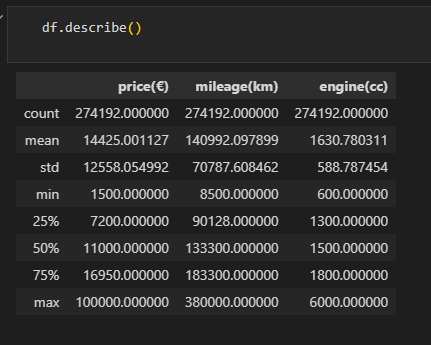
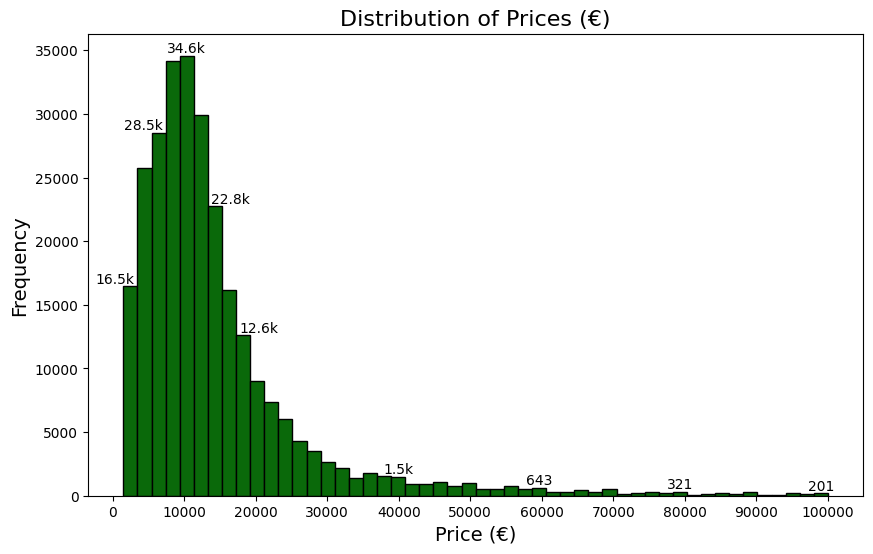
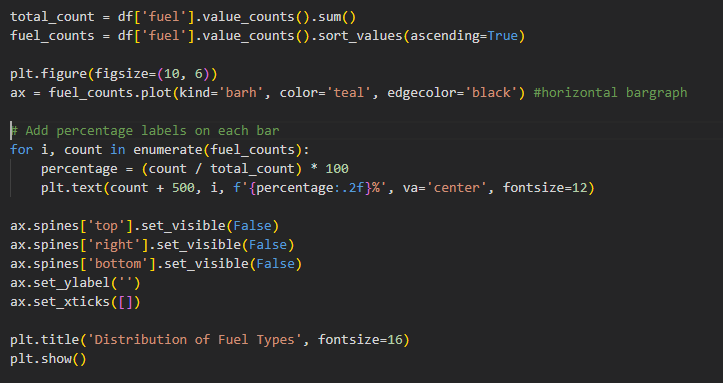
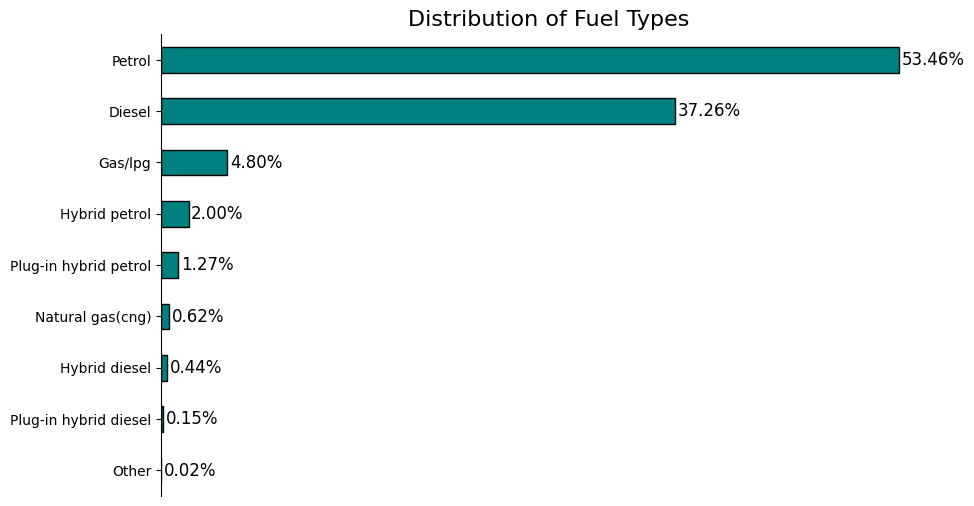
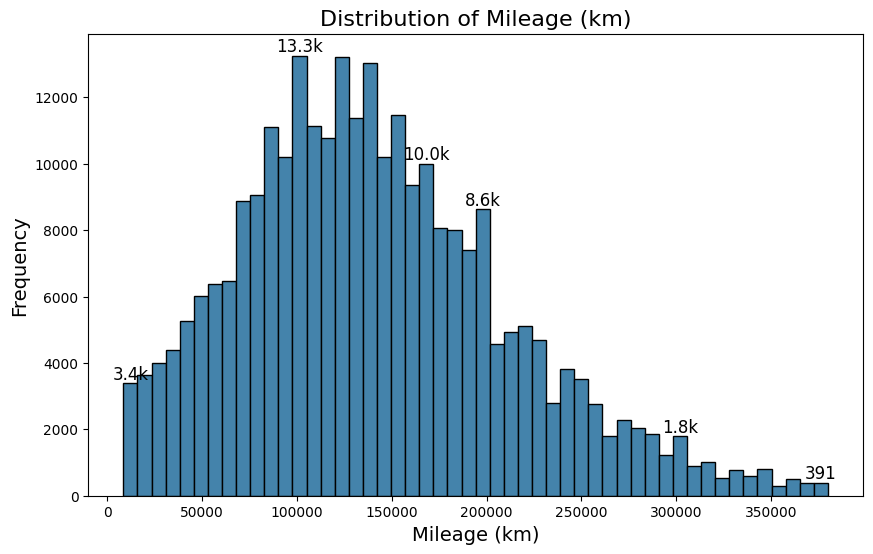
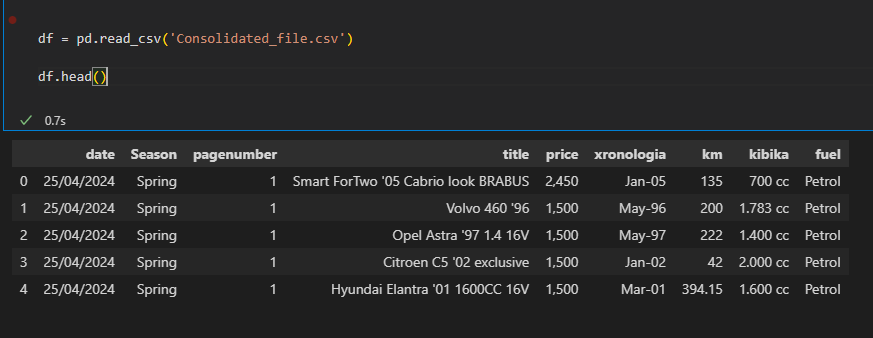
Full exploratory data analysis was run in Jupyter using Pandas, Matplotlib, and Seaborn before moving to hypothesis testing. Key market profile: median price €11,000, mean €14,425 (right-skewed), median mileage 133,300 km, petrol and diesel accounting for ~91% of listings.

Key findings

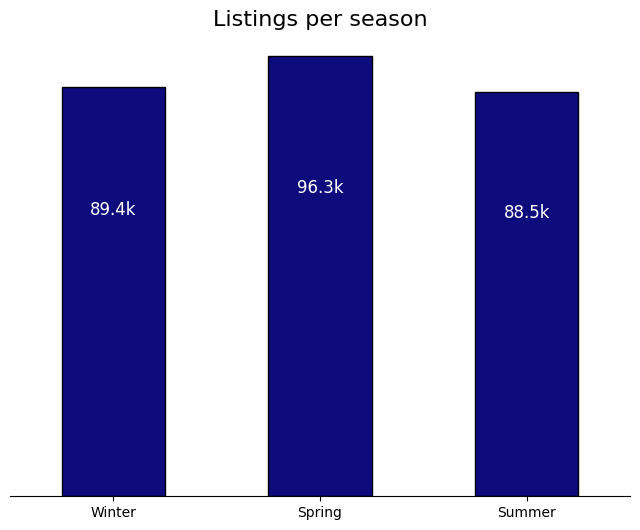
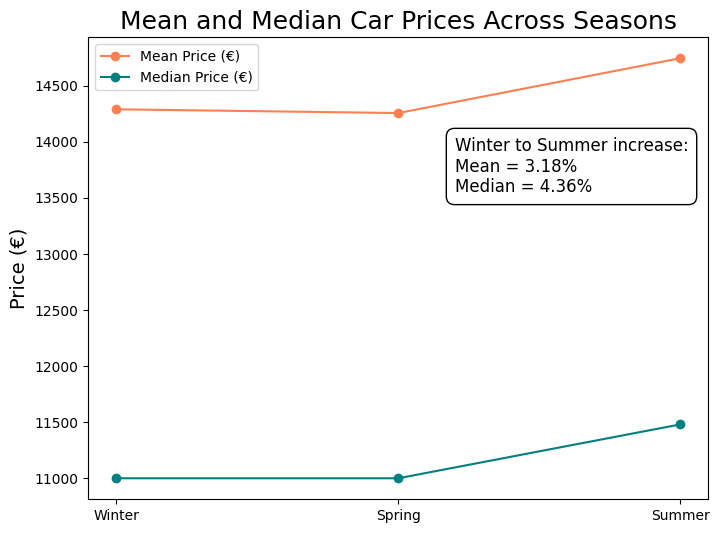
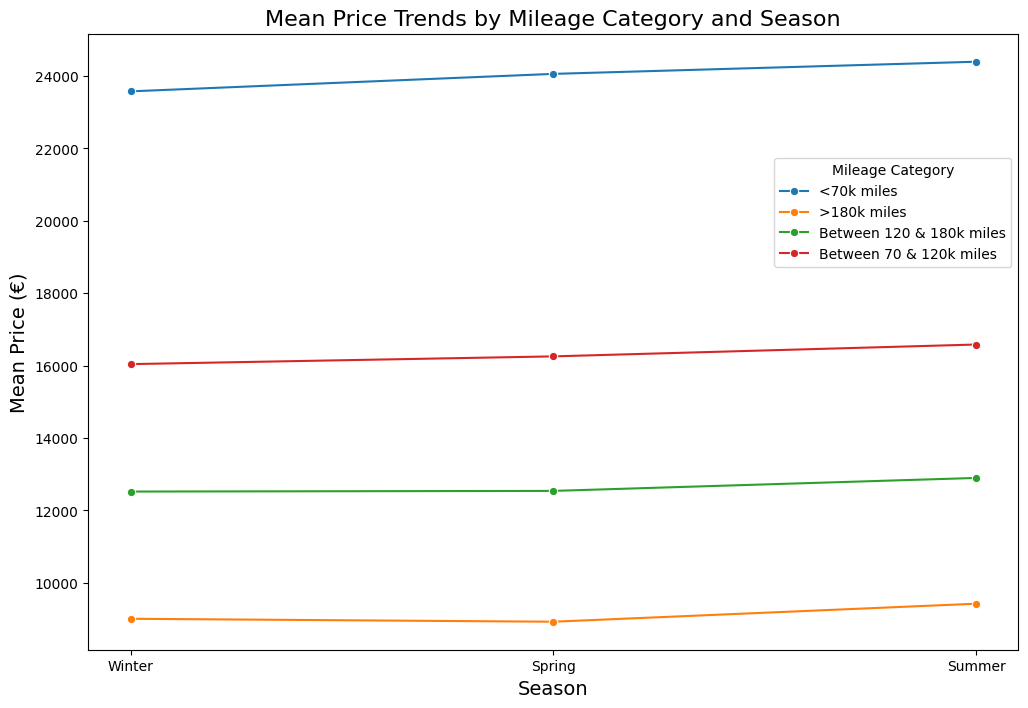
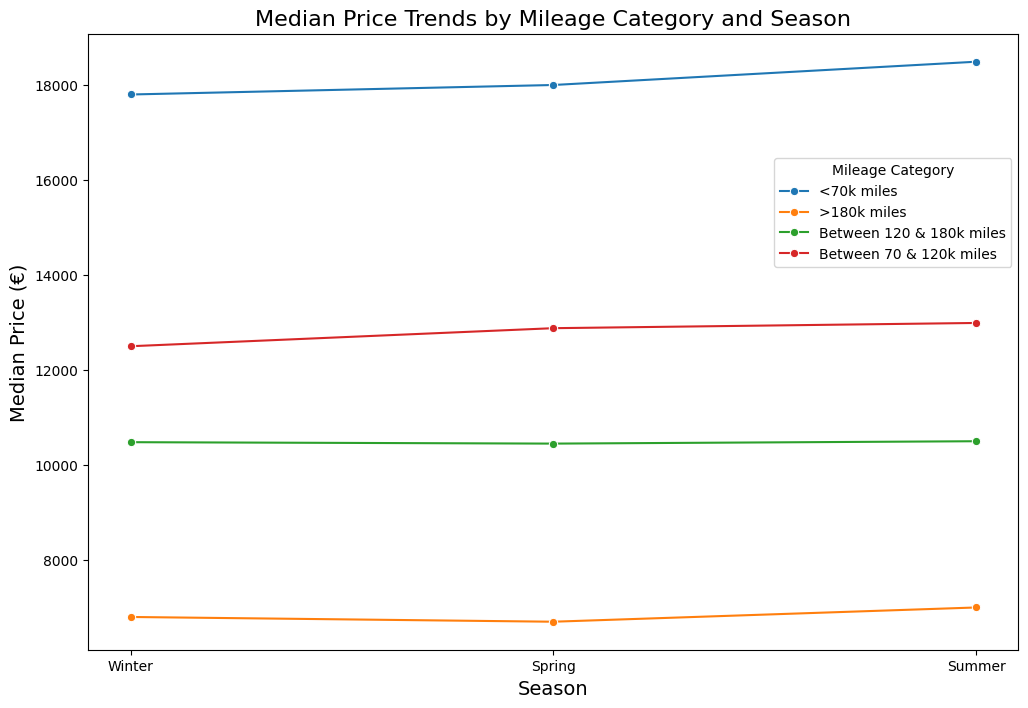
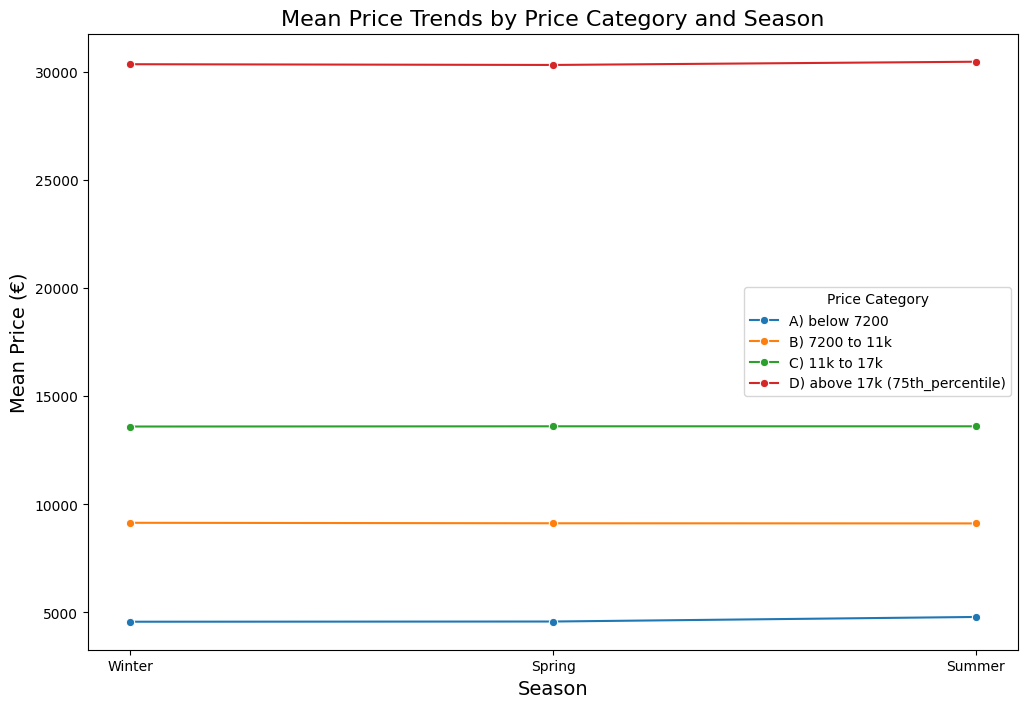
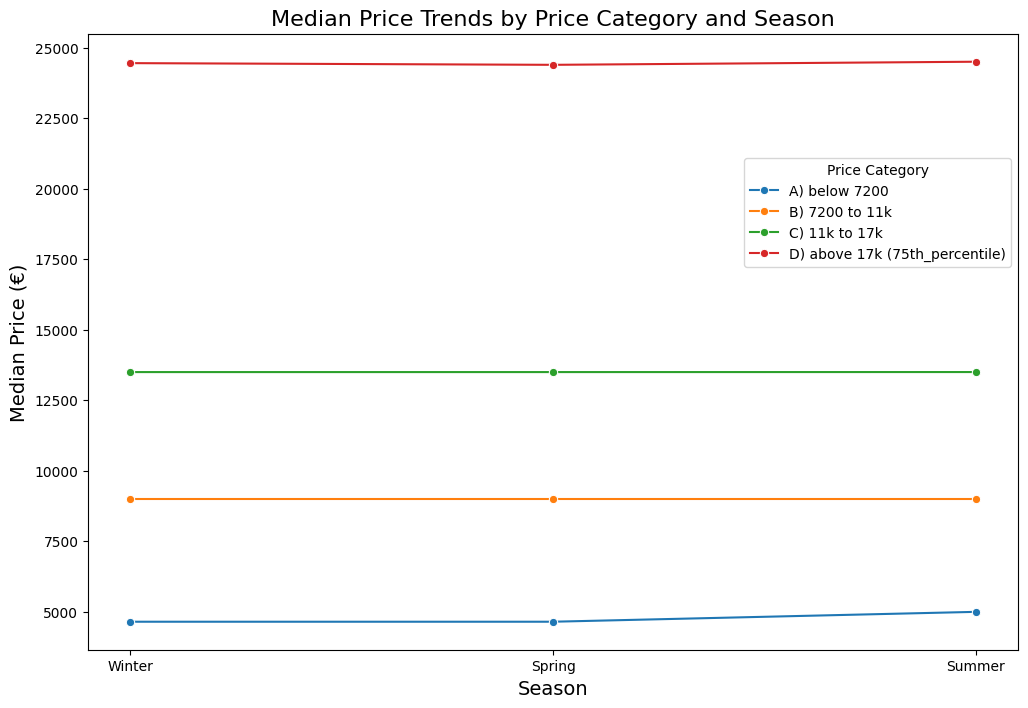
The hypothesis was not supported. Prices actually increase in summer, not winter.

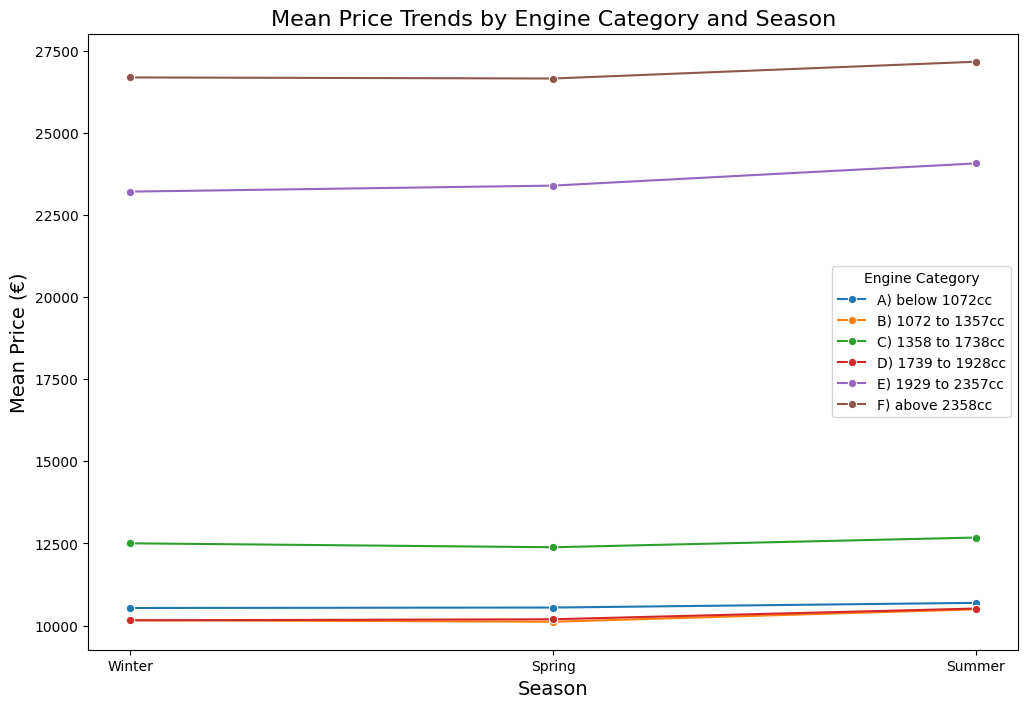
  • Summer mean price (€14,745) was higher than winter (€14,290) and spring (€14,256)
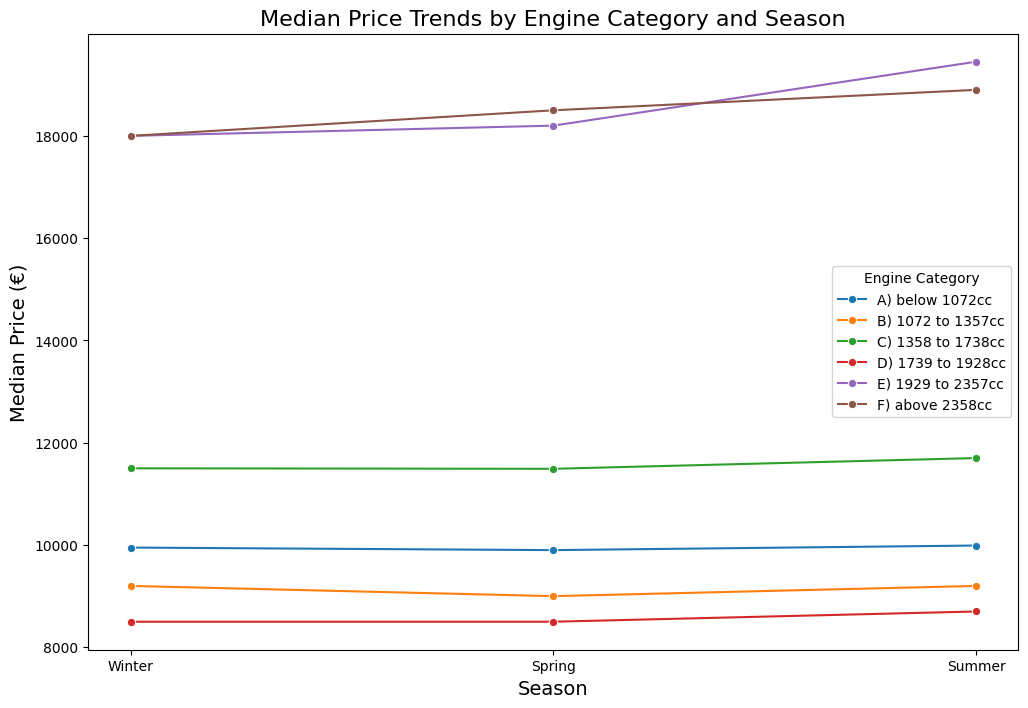
  • Mean price increased 3.18% from winter to summer; median increased 4.36%
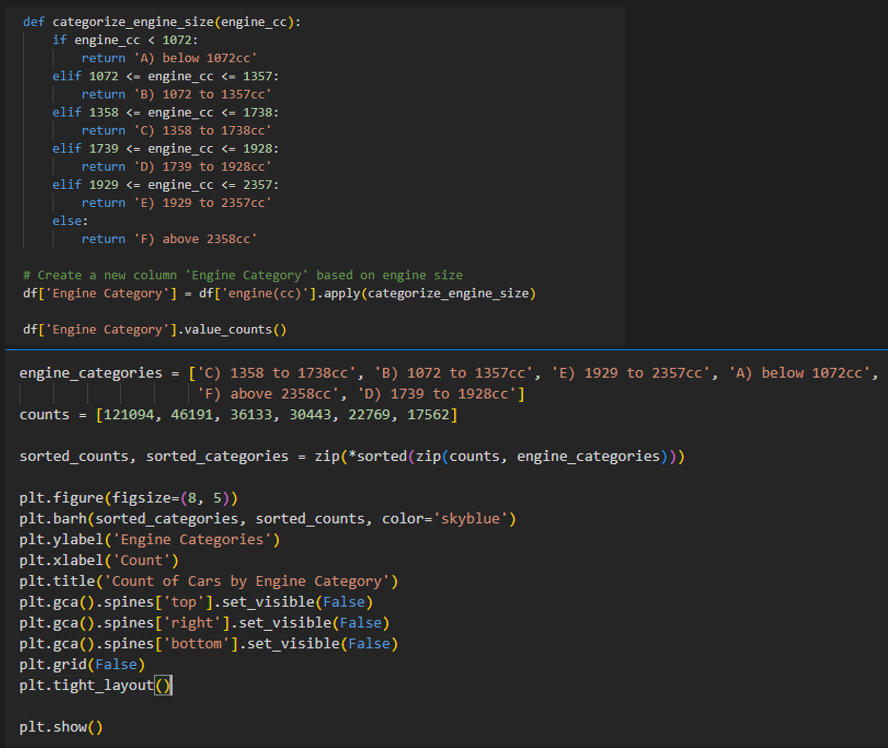
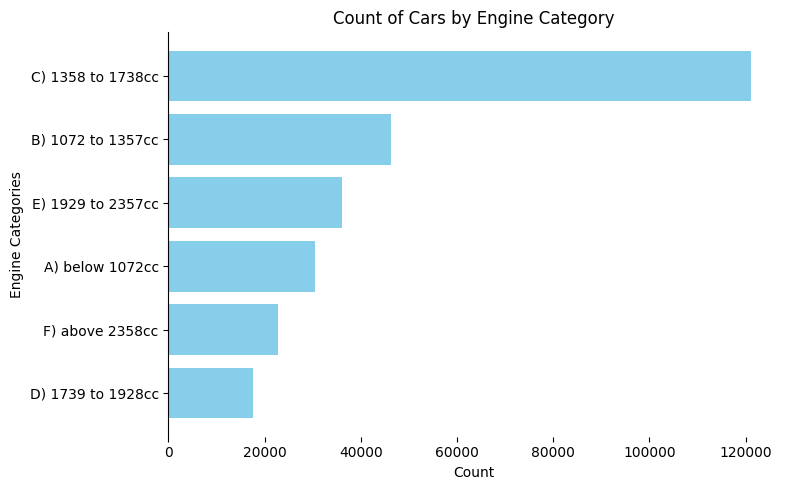
  • Larger engine sizes drove most of the mean price movement
  • Mean increased more sharply than median, indicating the influence of high-value outliers
  • Smaller engine categories (A, B) showed flatter seasonal trends, contributing less to the overall effect
  • Segmentation analysis by engine size, mileage category, and price category all consistently confirmed summer price increases
Python/Selenium web scraper code for Greek used car listings
Web scraper code
Python script for consolidating multiple CSV files from three scraping intervals
CSV consolidation script
Jupyter notebook — installing required Python libraries
Installing libraries
Jupyter notebook — importing Python libraries for data cleaning and analysis
Importing libraries
Jupyter notebook — importing the dataset and taking a first look at the raw data
Importing data — first look
Jupyter notebook — dropping irrelevant columns and renaming columns for clarity
Dropping and renaming columns
Jupyter notebook — dataset info showing 305,535 rows before cleaning
Dataset info (305,535 rows)
Jupyter notebook — checking for missing values across the dataset
Checking for missing values
Jupyter notebook — fixing data types for price, mileage, and engine columns
Fixing data types
Jupyter notebook — dataset head and describe output after data type processing
Data after type processing
Jupyter notebook — deduplication step removing approximately 22,600 duplicate records
Deduplication
Price boxplot showing outlier distribution in the Greek used car dataset
Price boxplot — outlier detection
Jupyter notebook — calculating the right whisker threshold for price outlier removal
Price — right whisker threshold
Jupyter notebook — removing mileage outliers using 1st and 99th percentile thresholds
Mileage outlier removal
Jupyter notebook — final clean dataset after all cleaning steps, 274,192 rows
Clean dataset
Descriptive statistics for the clean Greek used car dataset
Descriptive statistics
Jupyter notebook — code for plotting the price distribution of the clean dataset
Price distribution
Price distribution chart for Greek used car listings — right-skewed with median €11,000
Price distribution chart
Jupyter notebook — code for plotting fuel type distribution across listings
Fuel types
Fuel type distribution chart — petrol and diesel accounting for approximately 91% of listings
Fuel types chart
Engine size distribution chart across the Greek used car dataset
Engine size distribution
Mileage distribution chart for Greek used car listings
Mileage distribution
Jupyter notebook — code for plotting listing counts by season
Listings by season
Chart showing the number of used car listings by season across three data collection intervals
Listings by season chart
Jupyter notebook — calculating mean and median car price per season
Mean and median price per season
Chart showing mean and median used car price trends across winter, spring, and summer
Seasonal price trends
Jupyter notebook — counting cars by price category for segmentation analysis
Cars by price category
Chart showing the count of used car listings grouped by engine category
Cars by engine category
Jupyter notebook — calculating and visualising mean and median car price by season and engine category
Price by season and engine category
Mean price trends by engine category and season — showing summer price increases across engine groups
Mean price trends by engine category and season
Median price trends by engine category and season
Mean price trends by mileage category and season
Median price trends by mileage category and season
Mean price trends by price category and season
Median price trends by price category and season