Betting Account Performance Breakdown
2023Results (mock data)
Objective
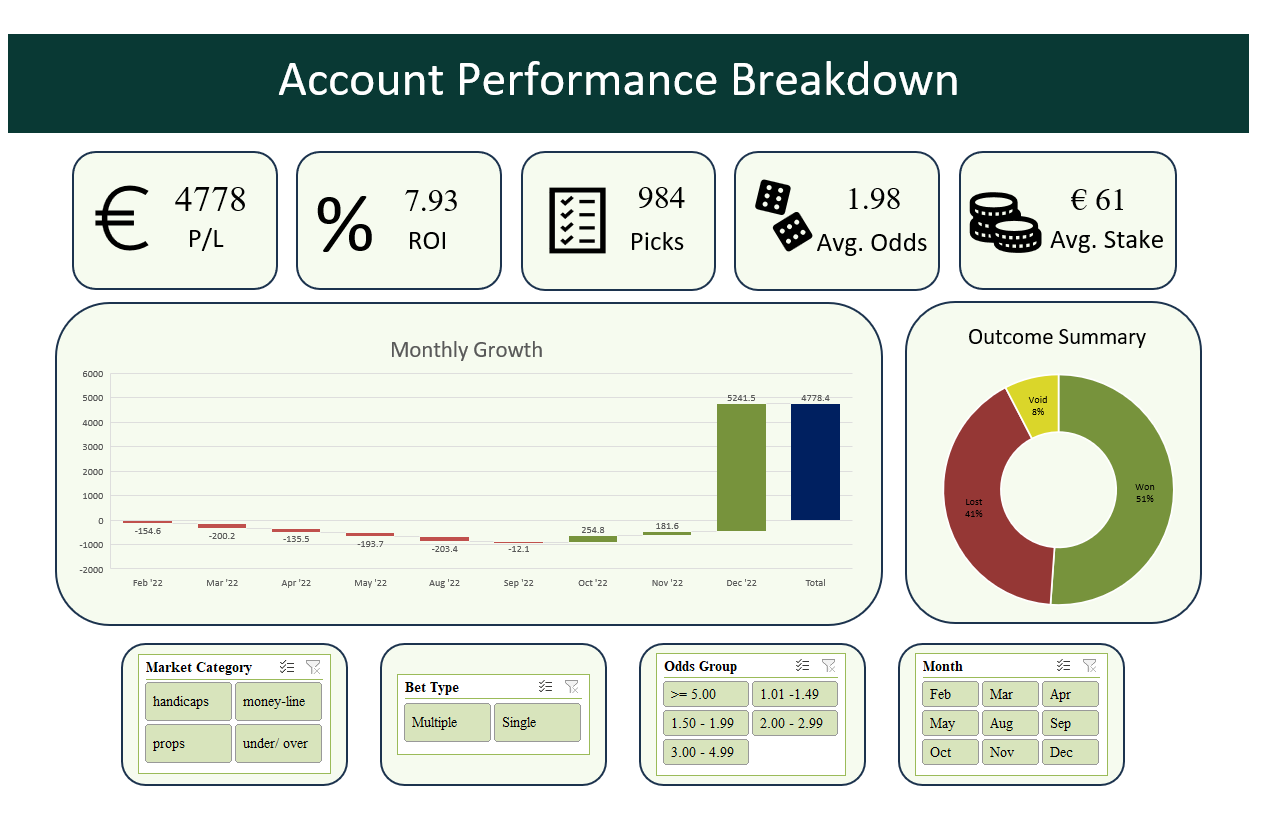
Track and analyse betting account performance for a Value Betting Syndicate, producing weekly reporting across key metrics: ROI, hit rate, picks volume, P/L, average stake, and average odds. Each metric compared against the 12-month average to surface meaningful trends rather than absolute numbers.
The published version of this project uses a mock dataset, not real account data.
Approach
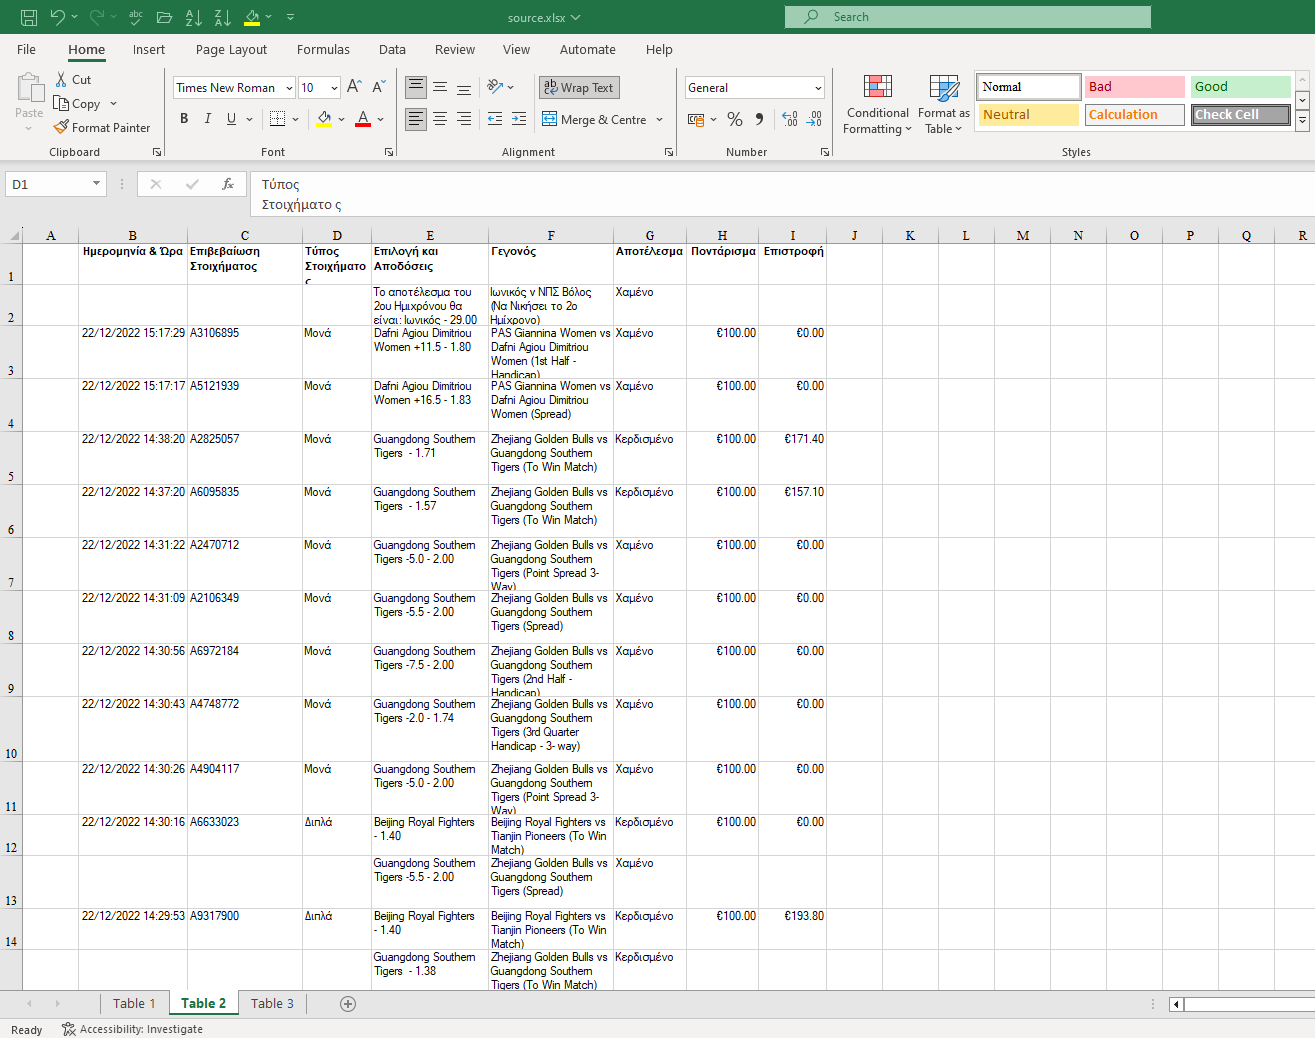
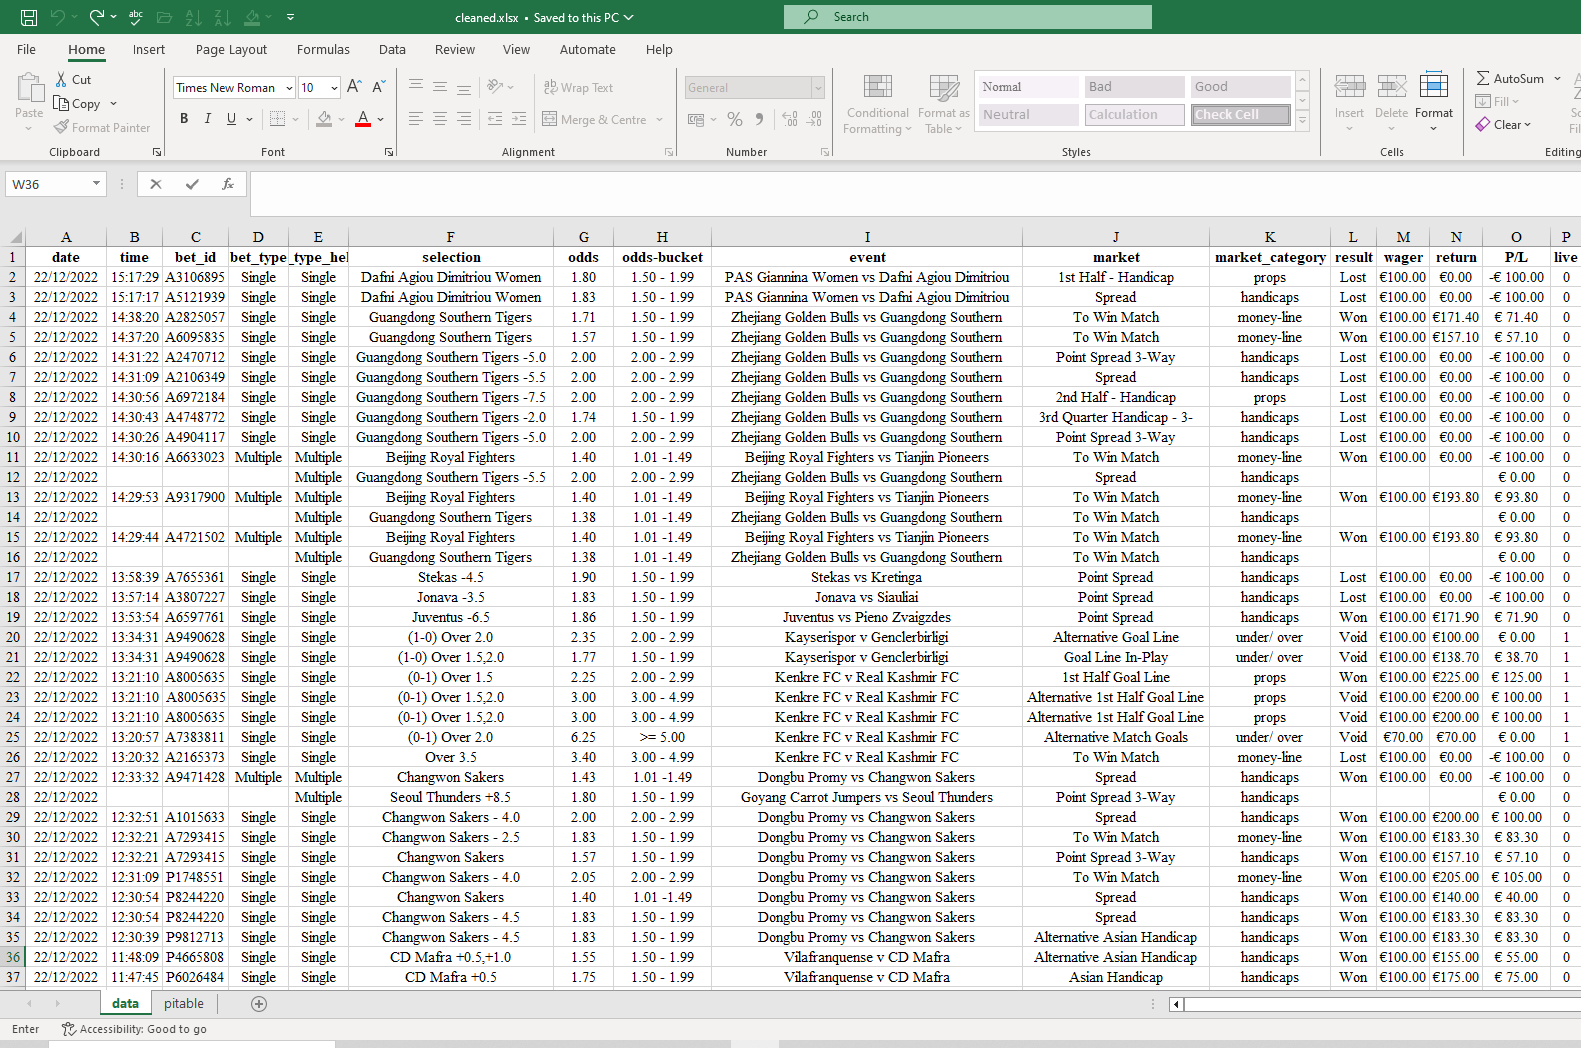
Raw betting data required significant processing before any analysis was possible. 11 steps from raw to clean: separating datetime into date and time, refining column labels, standardising odds format, cleaning the selection column, standardising bet type and result values, extracting market information, calculating P/L, flagging live bets, calculating any omitted data, creating odds buckets, and classifying market categories.
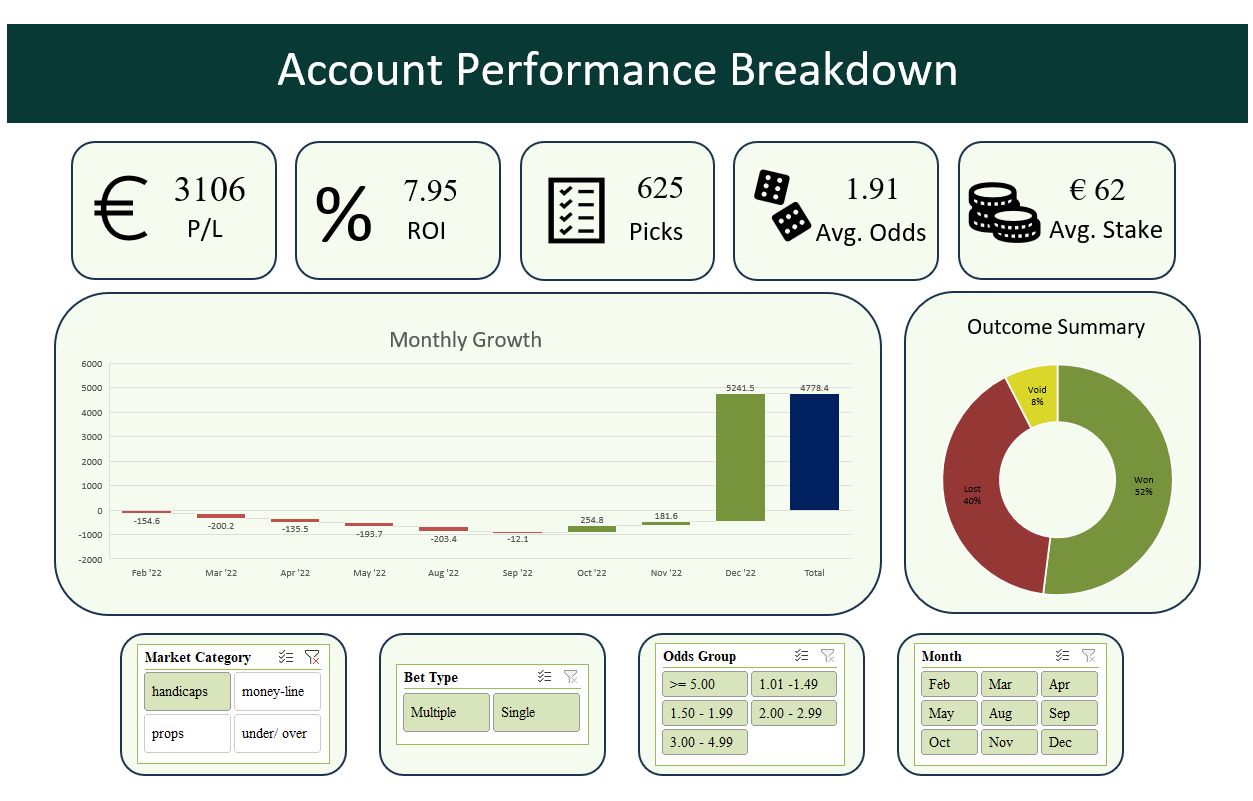
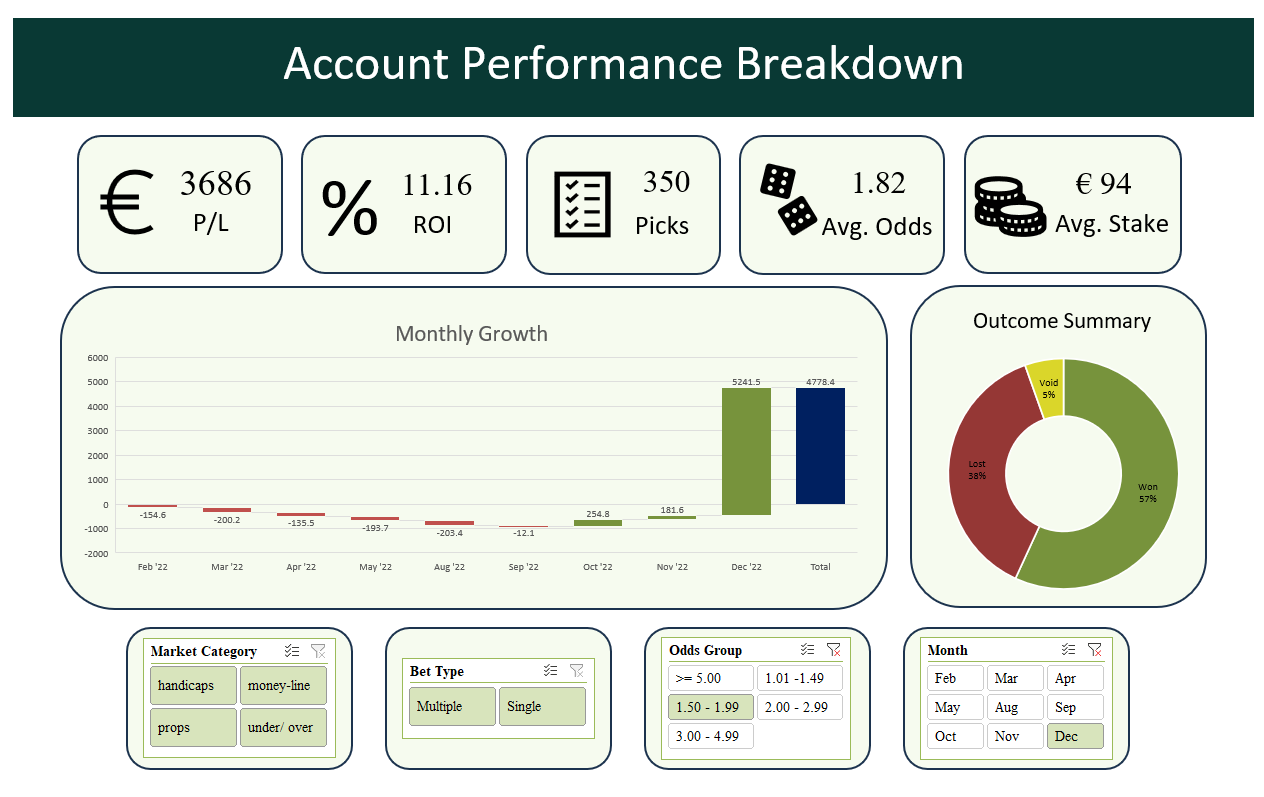
Analysis was built on pivot tables, with an interactive dashboard featuring filters for Market Category, Bet Type, Odds Group, and Calendar Month. Monthly growth visualisation included.
Key findings
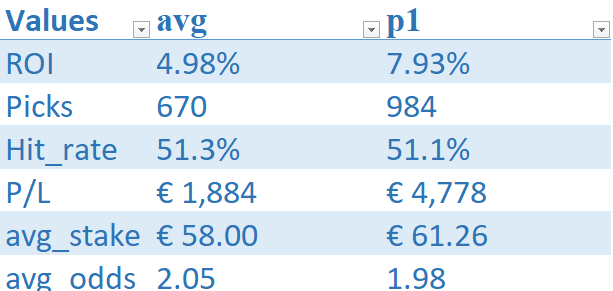
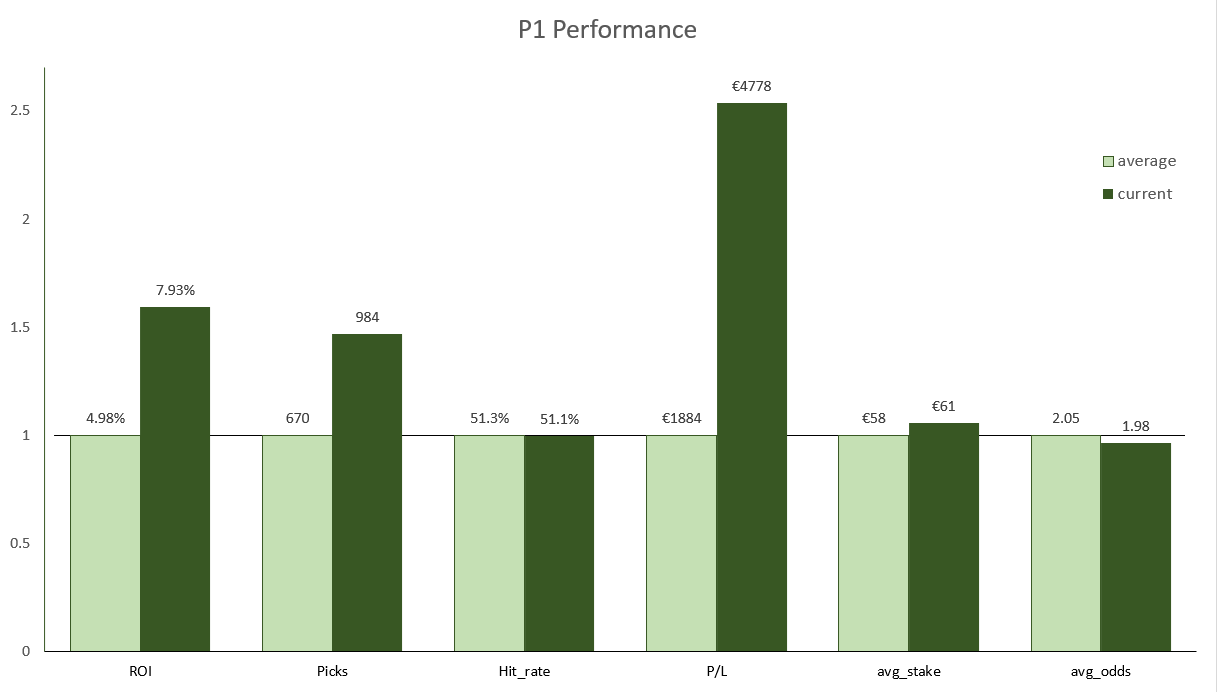
- ROI was 60% above the 12-month average for the period analysed
- Picks volume was 47% above average, indicating a higher-volume period
- Handicap bets were responsible for most P/L and approximately two-thirds of all picks
- Odds bucket 1.5–1.99 in December returned 110% of total P/L for the period
- Hit rate, average stake, and average odds were all around the 12-month average